
Data-Driven design
Directed data collection to generate insights that informed strategic design decisions across multiple projects and touchpoints.
Role: Lead UI /UX Designer, research and define critical user pain points, guiding a team of six to analyze data and shape design direction
Goal
To deliver a major content release that addressed churn, balanced competitive and casual engagement, and strengthened the overall player experience. Increase engagement and reduce the rate of decay from previous releases.
Ranked play was a key staple of the product. Competitive gaming in the first installment was so popular that it helped spark today’s $6B+ eSports industry.
CRITICAL CONTEXT
Market-Pioneering Discovery in 2010
In 2010, competitive modeling in games relied on simple models that assumed a static, normal user distribution. While analyzing proprietary data, our consulting Doctor of Mathematics, the first ever hired by a game company, was possibly the first to quantify, measure, and model the emerging 'shift and bulge' in user data, a phenomenon that is common knowledge today but not yet known or not yet discussed prior to 2010.
Invitation to Wharton School of Business
I was invited to the Wharton School of Business by Kevin Werbach, author of “For the Win”, to discuss this topic among others regarding game thinking in the business world, a concept known as gamification.
Problem Statements
Lower-skilled players were leaving at a higher rate than the rest of the population.
The Team
Our project was driven by a cross-functional team, including:
Data Scientists (2): Focused on data pipeline to collect data for analysis.
Doctor of Mathematics, Ph.D.: Applied deep expertise in probability and curve functions. (We were the first game company to have hired a doctor of mathematics.)
Developers (3): Implemented the required instrumentation for data tracking and deploying the final design features.
Myself: Conducted qualitative research, formulated the core hypotheses, led collaborative analysis to interpret the quantitative data, and drove the final design.


DESIGN PROCESS

Research

Hypothesize

Design

Test
AMAZING DISCOVERY
1. The shift
After collecting the data and taking a quick a look at it, the analysts realized the bell curve was shifting to the right. To our knowledge, no one had every seen this or at least they had never talked about it. No other game had the number of players our game has and no one has the team do the analysis we could do.
2. The bulge
Aside from the shift, the normal distribution wasn’t normal anymore. The top peak was followed by a trough, a smaller peak, followed by the rest of the normal distruption. Again, this is not someone has evet talked about.
The Implication
When the bell curve shifts, the left-most curve does not shift 1:1; rather, the tail shrinks and contracts as lower-skilled players leave the system. This structural decay—a major focus of competitive game design analysis in the early 2010s following the launch of titles like StarCraft II (2010)—drives a self-accelerating cycle of player churn and skill inflation.
The solution
We reset the curve, but we knew we could reset it daily. We decided 3-4 months would be decent spot, so we decided 3 months

QUALATIVE USER RESEARCH
I began with qualitative research to understand users’ pain points and that would help determine which numerical data to collect.
Monitor online forums
Solicit community feedback
Build user empathy
Review CEO’s firsthand experience
Stay around the water cooler
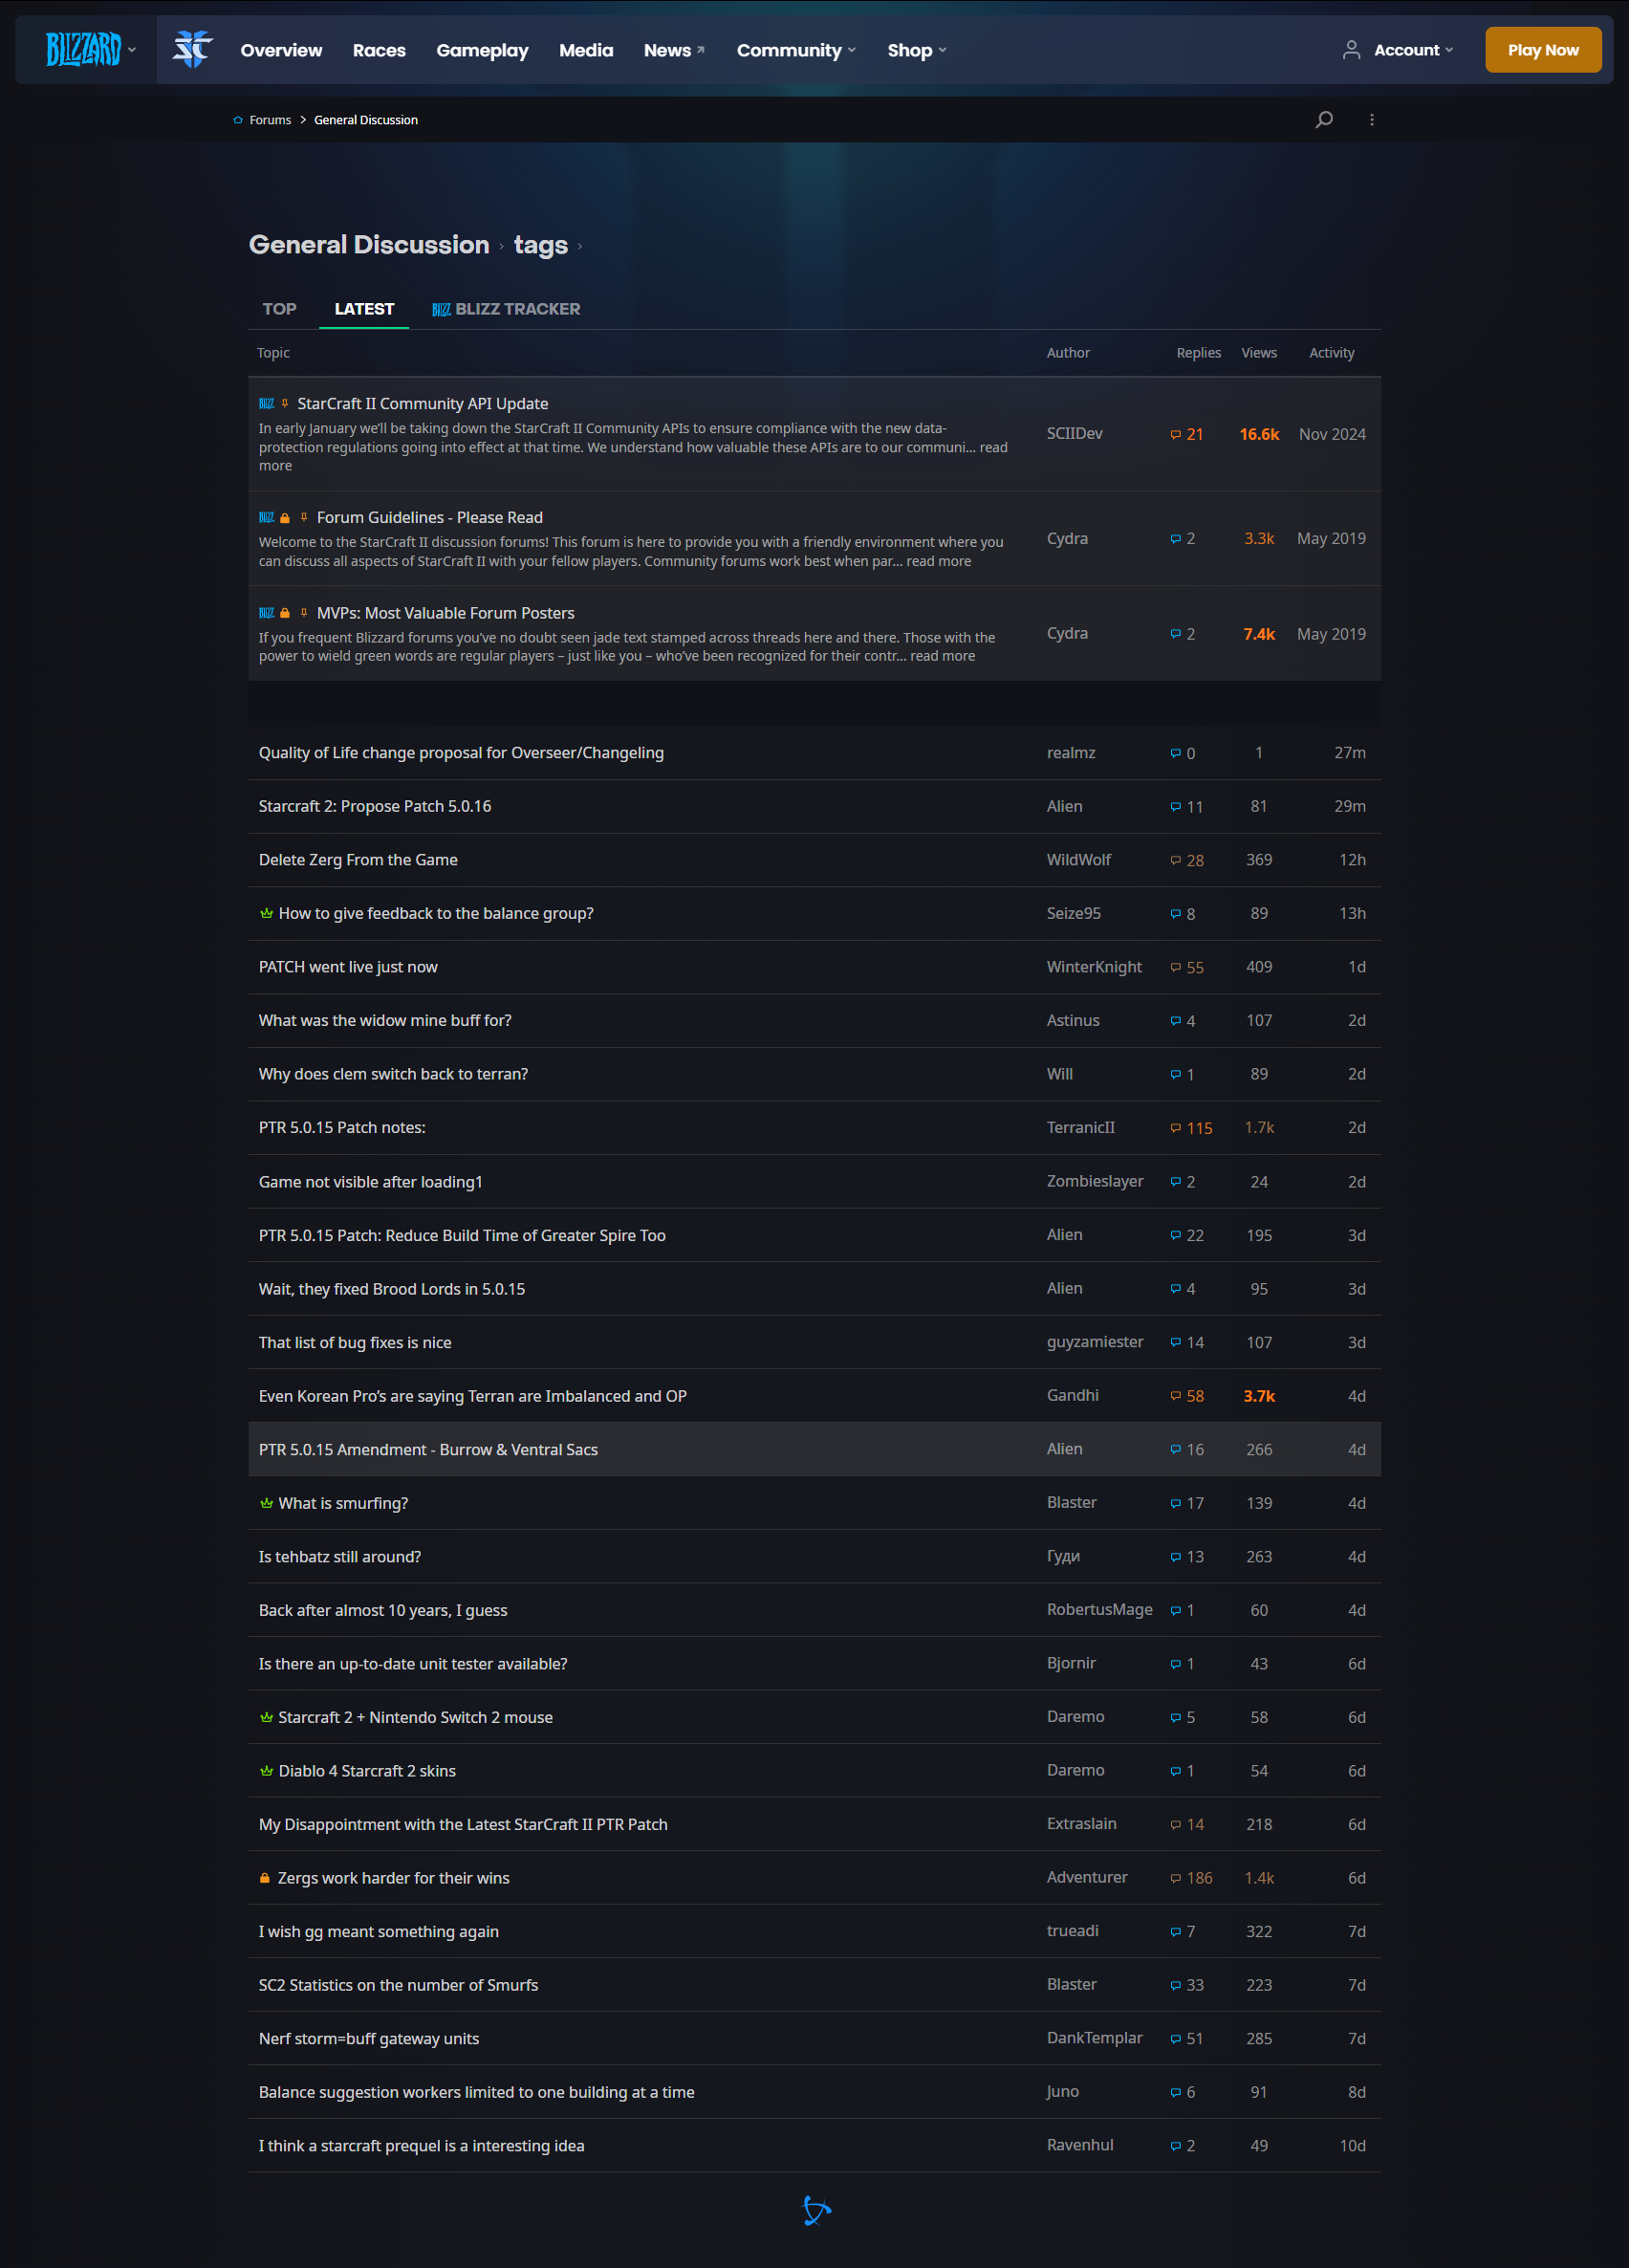
I monitored online discussions daily to capture user sentiment.
HOW TO GATHER eDATA
Gathering the information on rating, win / loss ratio was pretty straight forward, but there was other quantitive data that we needed to gather in order to make meaningful conclusions. Fortunately we had a cost-effective method that could get us a broad range of data through something built earlier called the “Achievement” system.
QUALTATIVE / QUANTATIVE PERSONAS
Reverse Engineers
Who: Two college students, one from MIT and one from UC Berkeley, who closely tracked every change we made to the system. They frequently posted on forums and detailed their observations in blogs.
Findings: Their analyses were remarkably accurate.
Thoughts: They had a deep understanding of our system. Even if we wanted to prevent them from doing so, we couldn’t.
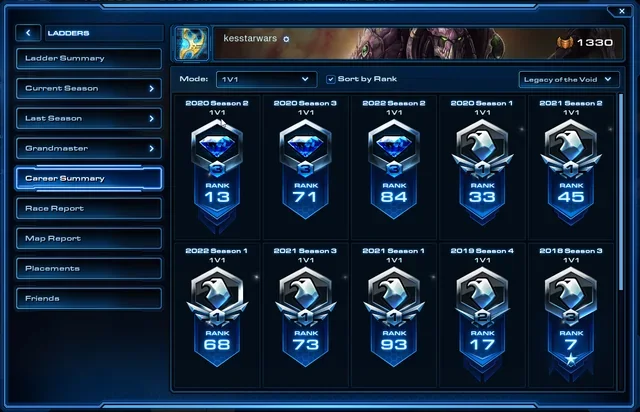
Elo
Who: Players who care deeply about their rating number, similar to chess players. They often follow what the Reverse Engineers. They focus mainly on their own score rather than the rank we assign. These players sit at the far right of the bell curve, typically borderline Master, Master, or Grandmaster. Some are professional eSports players who play anonymously for fun. However, many mid-level players also cared about their rating. Across both groups, the number itself mattered most.
Findings: Nothing we didn’t already know
Thoughts: Our goal was to make the rating system as accurate as possible for them. Supporting the top segment was straightforward since they understood the system, but mid-tier players cared about their number without understanding how it worked and were mostly satisfied as long as it felt fair.
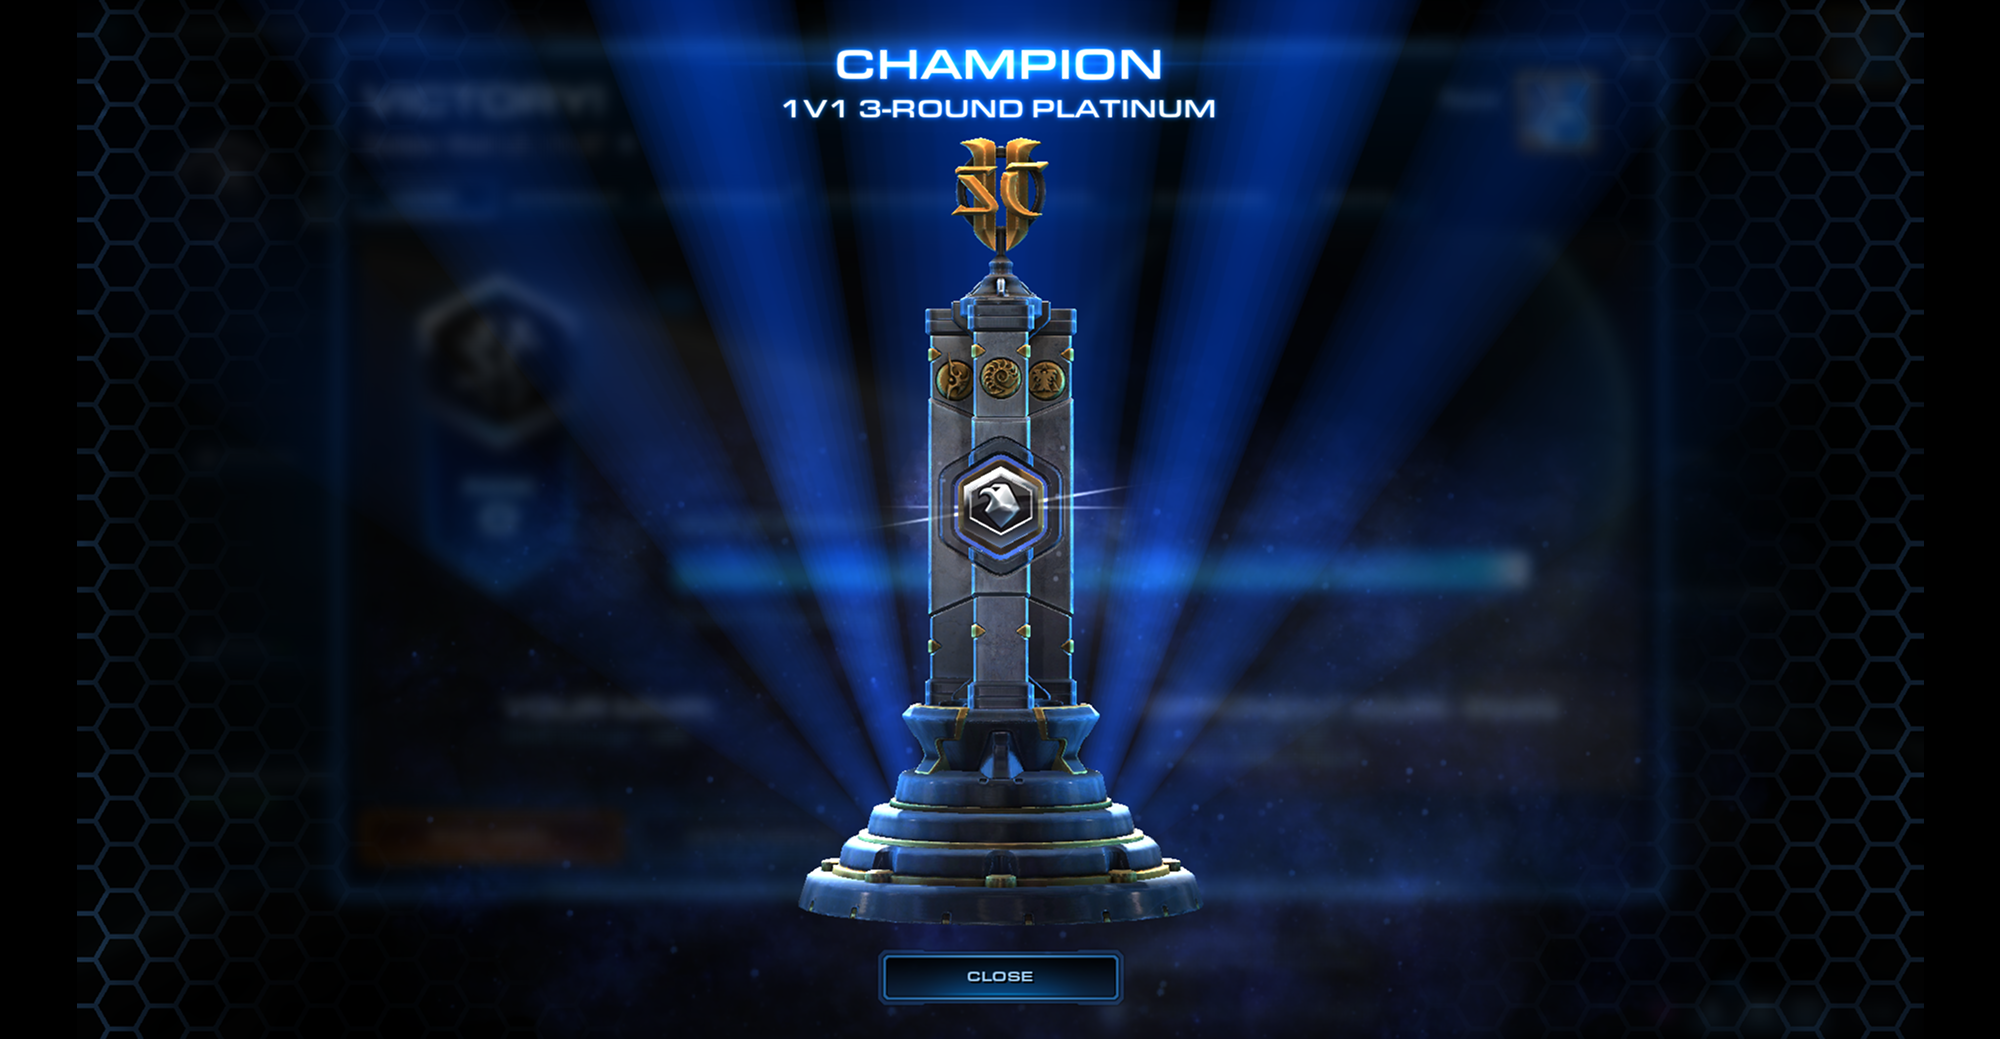
Medalist
Who: Players who don’t know about Elo, trust the system, and care primarily about the rank we assign them (Bronze, Silver, Gold, Platinum, Diamond).
Findings: This group made up the majority of the audience. They cared deeply about their rank and often bragged about it. Many would say things like “I’m in Gold, but near the top of Gold.” When we checked the data, they were usually far from the top but still having fun. However, this group was also at risk of churning if they felt stuck.
Thoughts: This was our core audience. They were enjoying the game, but we wanted to prevent frustration from feeling trapped in a rank. As long as they hovered around a 50% win rate, engagement stayed high. The key was ensuring that play continued to feel fair and fun, even when progress slowed.
Casual
Who: Players to the immediate left of the bell curve
Findings: We actually saw a lot more people drop off from early bronze to mid silver.
Thoughts: This actually made sense. Like bottom bronze they were getting significantly better. but weren’t getting feedback. The ones close to the middle were kind of having fun bouncing back and forth between silver and gold, but to an extent. they didn’t feel the need to brag but they also were having a less than 50% ratio with no positive reinforcement. it likely felt like limbo
Uber Casual
Who: Players like our CEO who simply enjoyed the game.
Findings: Uber-Casual players played more matches than expected, even while losing frequently. When they did win, their true skill rating jumped significantly, sometimes equivalent to moving from Gold to Platinum. However, their visible rank remained stuck at Bronze. Many eventually churned because they felt there was no way out.
Thoughts: These players were improving at a remarkable rate, yet the system didn’t recognize or reward their progress. Since they didn’t know or care about Elo, they had no sense of how much they’d actually grown.
HYPOTHESIS
Changes
We focused on making changes to 3 personas.
Fixing the Shift and bulge would flat out help everyone. We didn’t know to what extent but we knew we had to do it.
Giving separate MMRs for each race would give better matchmaking.
Uber Casual: If we gave them positive reinforcement, they would play more games. It didn’t have to come to win ratio. If they got positive reinforcement, they would still be inclined to play. When they do, the system will be more healthy overall.
Casual: Similar to uber casual. Do something similar but don’t make it a complete progression system.
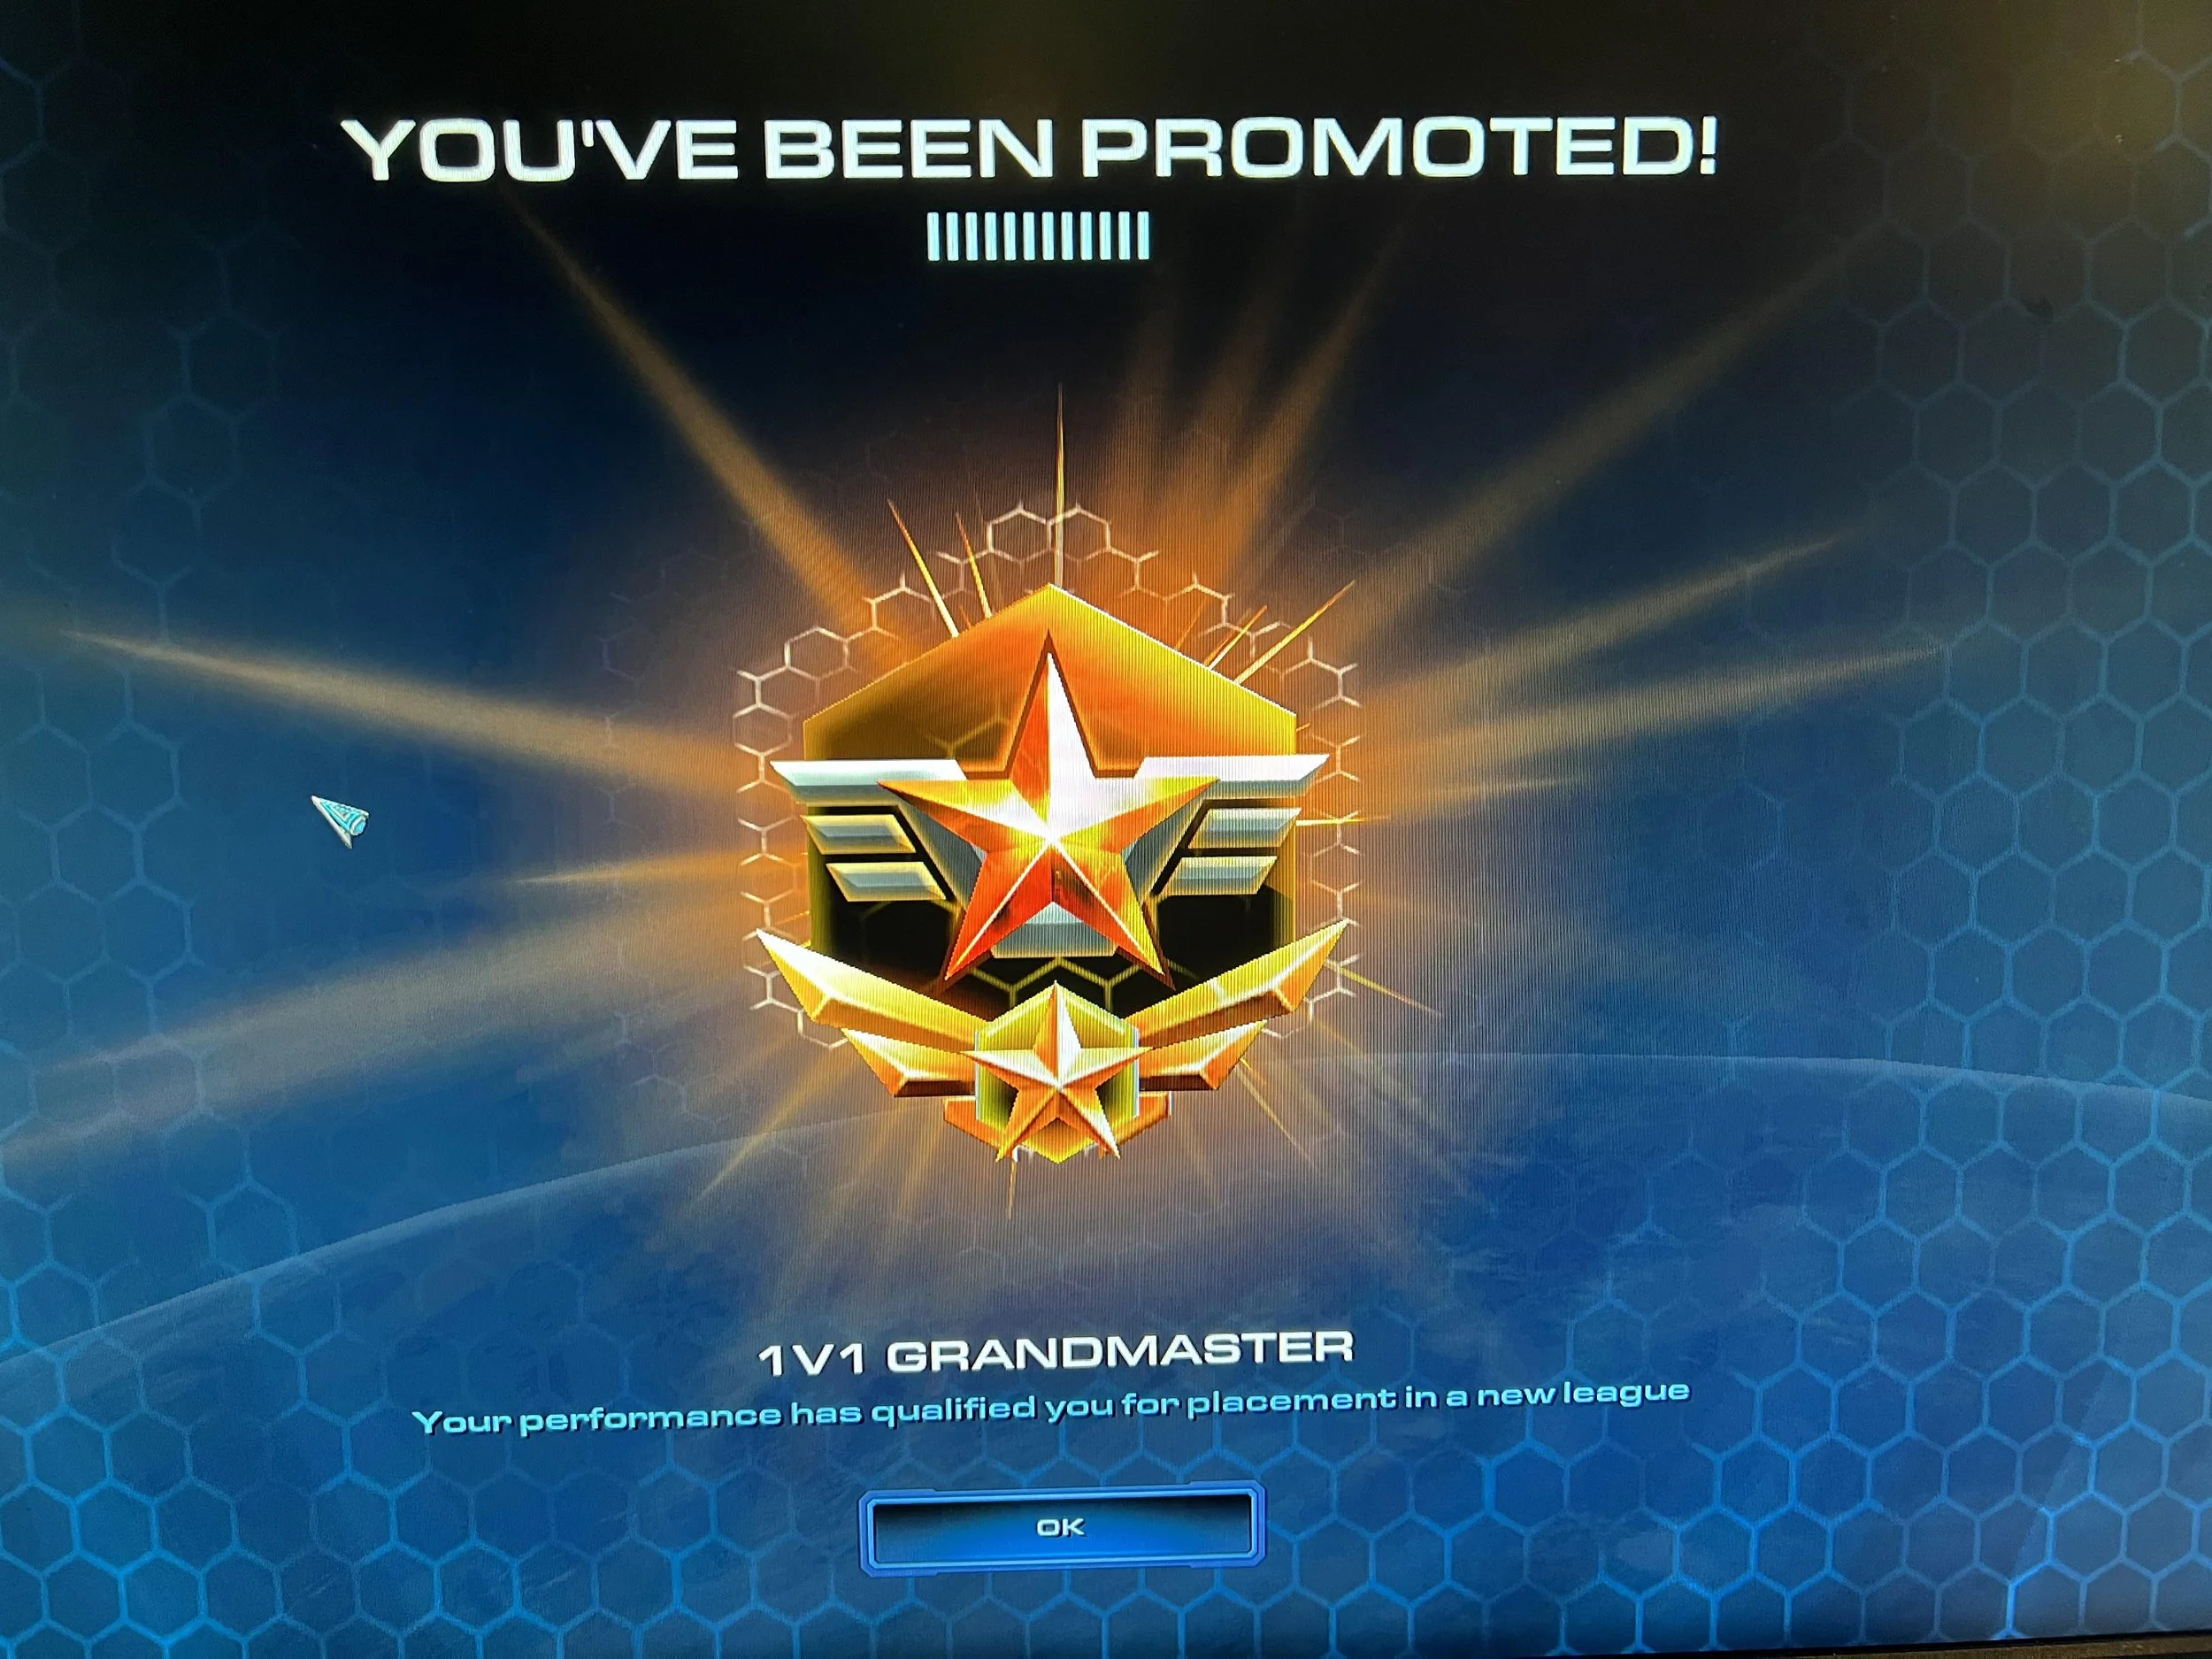
Medalist: Give them more positive feedback and rewards. Give them reasons to brag, post on social media about their excitement. These guys will stick around if the Elo people are happy and they’re getting medals.
DESIGN
Uber casual: Replace the ranking system with a progression system.
Uber casual - Medalist: Give them a progress / ranking system
Medalist: Give them a ranking / progression system.
Elo: Give them a ranking system
DESIGN
We focused on making changes to 2 personas.
Fixing the Shift and bulge would flat out help everyone. We didn’t know to what extent but we knew we had to do it.
Uber Casual: If we gave them positive reinforcement, they would play more games. It didn’t have to come to win ratio. If they got positive reinforcement, they would still be inclined to play. When they do, the system will be more healthy overall.
Casual: Slow down the ranking reward.
Medalist: Give them more positive feedback and rewards. Give them reasons to brag, post on social media about their excitement. We can make it lenient before they get demoted and little easier to get promoted to gold. These guys will stick around if the Elo people are happy and they’re getting medals.
Churn in the bottom 3% was high possibly due to lack of positive reinforcements, low win rate, lack of interest in competitive play, or other unknown reasons.
With the nature of this, we couldn’t create the hypothesis and make major tweaks. However, we did implement some knobs to twist and turn for minor adjustments manually and have them set to automatic once we were comfortable. We wanted to future-proof it.
CHANGE HIGHLIGHTS
Map personas in real-time to deliver targeted, custom experiences
When the bell curve shifts, the left-most curve does not shift 1:1; rather, the tail shrinks and contracts as lower-skilled players leave the system. This structural decay—a major focus of competitive game design analysis in the early 2010s following the launch of titles like StarCraft II (2010)—drives a self-accelerating cycle of player churn and skill inflation.
With the nature of this, we couldn’t create the hypothesis and make major tweaks. However, we did implement some knobs to twist and turn for minor adjustments manually and have them set to automatic once we were comfortable. We wanted to future-proof it.
Churn in the bottom 3% was high possibly due to lack of positive reinforcements, low win rate, lack of interest in competitive play, or other unknown reasons.
CHANGE HIGHLIGHTS
When a competitive ranking system's bell curve shifts, the left-most curve, representing the lowest-skilled players, does not shift 1:1; instead, the tail contracts and depopulates.
This structural decay, a critical subject of developer analysis and community dissection, is strongly linked to the launch and maturation of large-scale competitive titles like StarCraft II (2010), which popularized the modern tiered ladder system. The vast player data and public scrutiny of StarCraft II's ranking system provided the foundational evidence for why new players churned and how the entire skill distribution became artificially inflated—a process where lower-skilled players leave, the average skill of the remaining pool rises (shifting the curve right), and a "bulge" of veteran players forms at mid-to-high ranks.
When the bell curve shifts, the left-most curve does not shift 1:1; rather, the tail shrinks and contracts as lower-skilled players leave the system. This structural decay—a major focus of competitive game design analysis in the early 2010s following the launch of titles like StarCraft II (2010)—drives a self-accelerating cycle of player churn and skill inflation.
When a competitive ranking system's bell curve shifts, the left-most curve does not shift 1:1; instead, the tail contracts and depopulates. This structural decay—where the overall skill distribution inflates and the lower end is starved of players—was a critical subject of analysis that emerged in the early 2010s, directly following the launch of large-scale competitive titles like StarCraft II (2010). Crucially, the deepest initial understanding of this issue, including the identification of the recursive churn and right-side "bulge", came from teams who applied rigorous, high-level mathematical expertise (such as a doctor of mathematics) to dissecting the live player data, giving your community a lead on diagnosing this fundamental competitive flaw before it was widely understood by the rest of the industry.
Churn in the bottom 3% was high possibly due to lack of positive reinforcements, low win rate, lack of interest in competitive play, or other unknown reasons.
CASE STUDY
SOCIAL PLAY
ANALYSIS
USER RESEARCH: Lower-skilled players found the ranking system frustrating.
HYPOTHESIS: The system experienced recursive churn as lower-end users along the normal distribution stopped playing.
DATA: The lowest 5% saw little reward for wins despite skill gains, resulting in attrition.
DATA: Over time, the normal distribution shifted in a way that disadvantaged the lower half in terms of rewards.
SOLUTIONS
Provide more positive reinforcement for the bottom 25% of players.
Automatically readjust the normal distribution every three months to maintain the desired experience and future-proof the system.

This YouTube video highlights changes and reasonings behind them. Later, I gave a similar presentation at the Wharton School of Business on gamification.
Added rewards for eSports-focused personas.

Launched a major casual content initiative with a new designer on the team.
RESULTS
Compare to the last major release, we saw substantial benefts across the board, aside from Master and Grandmaster who were already engaged. The bell curved remained healthy.
+40%
User retention
+500%
User engagement
88%
Metacritic score
Alexander Sun
AlexanderSun@gmail.com | (949) 302-9139 | linkedin.com/in/alexandersun